|
|
|
To: 7.2.3 Drift velocity |
 |
For the Stokes flow ![]() , the exact solution exists:
it is simply a superposition of
two single diffusing vortices. Figure 7.3
shows the vorticity distribution along the line connecting the
initial point vortices.
There is excellent agreement between the exact solution and the
computed vorticity.
This is also evident from the computed vorticity lines
figure 7.4.
As demonstrated by Van Dommelen [235], a
standard random walk approach would experience considerable difficulty
with this flow
since vanishing vorticity is there approximated
by roughly equal amounts of negative and positive vortices of the initial
strength.
, the exact solution exists:
it is simply a superposition of
two single diffusing vortices. Figure 7.3
shows the vorticity distribution along the line connecting the
initial point vortices.
There is excellent agreement between the exact solution and the
computed vorticity.
This is also evident from the computed vorticity lines
figure 7.4.
As demonstrated by Van Dommelen [235], a
standard random walk approach would experience considerable difficulty
with this flow
since vanishing vorticity is there approximated
by roughly equal amounts of negative and positive vortices of the initial
strength.
Unfortunately, for nonzero Reynolds number no exact analytical solution is
available to show how well the nontrivial convection effects are
represented.
Instead, we use the second order expansion derived by Van Dommelen & Shankar
[230] which is valid for sufficiently small times.
To obtain high resolution for small times,
we performed the computations in this section
at
![]() .
.
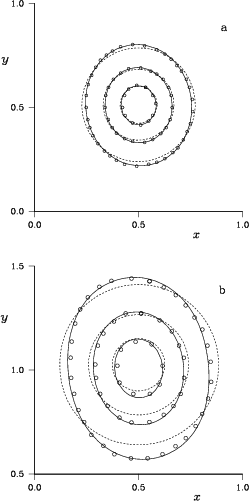
Figure 7.5 shows vorticity contours
for Reynolds number ![]() at two early times.
The dashed curves in this graph represent the first order solution
given by a simple superposition
of single vortex solutions, while the solid curves include the next
order in the small time expansion developed by
Van Dommelen & Shankar [230].
The difference between the curves represents nontrivial convection
effects.
Since the two curves are close together in figure
7.5(a), we expect
the small time approximations to be very accurate; hence
the exact solution should be close to the solid curve.
Our computations do reproduce this expected curve closely.
We consider this to be excellent performance of both the
small time expansion and our numerical scheme (especially for
a vortex method with an arbitrary point distribution).
Note that the time is no longer truly small: the vortices have
already expanded to a size comparable to their distance!
at two early times.
The dashed curves in this graph represent the first order solution
given by a simple superposition
of single vortex solutions, while the solid curves include the next
order in the small time expansion developed by
Van Dommelen & Shankar [230].
The difference between the curves represents nontrivial convection
effects.
Since the two curves are close together in figure
7.5(a), we expect
the small time approximations to be very accurate; hence
the exact solution should be close to the solid curve.
Our computations do reproduce this expected curve closely.
We consider this to be excellent performance of both the
small time expansion and our numerical scheme (especially for
a vortex method with an arbitrary point distribution).
Note that the time is no longer truly small: the vortices have
already expanded to a size comparable to their distance!
At still later times, the small time expansion is probably no
longer accurate, since it is based on the approximation that the size
of the vortices is small compared to their distance.
The inaccuracy is reflected
in sizeable differences between the solid and dashed curves
in figure 7.5(b).
While the exact solution is now no longer certain, we still believe that it
is accurately represented by our numerical solution.
One reason is that the computed solution is closer to the solid curve;
secondly, we expect the next higher-order term in the small time
expansion to have three periods
along a contour, which seems to agree with the number of curve
crossings in figure 7.5.
Table 7.2 shows the number of vortices and computational times
at ![]() . The computations were carried out
in 32 bit precision on a VAX4000-300 computer running VMS V6.0.
. The computations were carried out
in 32 bit precision on a VAX4000-300 computer running VMS V6.0.
 |
This study used algebraically decaying vortex cores, rather than the somewhat more usual exponentially decaying ones [17]. To check the effect, we repeated the computation of figure 7.5 using exponentially decaying cores: we used a second-order Gaussian core instead of (6.3) for convection, while at the end of the computation, the vorticity was evaluated using a fourth-order Gaussian core (6.13). The results in figure 7.6 show that the effect is negligible, although the Gaussian results seem slightly less accurate based on the comparison with the small time expansion at the earlier time.
 |
The small time expansion also predicts an increased symmetry of the vorticity distribution about the line connecting the vortex centers for increasing Reynolds numbers. That is evident in the vorticity contours of figure 7.7. At later times the results are considerably less symmetric, as shown in figure 7.8. In particular, the outer contour line at Reynolds number 50 seems to develop a leeward tail similar to the one found by Buntine and Pullin [32]. Their case of axisymmetric strain is equivalent to no strain after rescaling.
 |
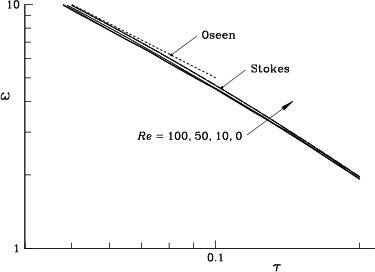
Our vorticity contour lines are close to those of Ohring and Lugt [166], although there seem to be some minor differences in the maximum value. Figure 7.9 depicts our results for the maximum vorticity as a function of time, along with the Oseen (small time or single vortex) and Stokes (large time) values. Our results follow the Stokes curve closely regardless of Reynolds number; this agrees with the results of Lo and Ting [132] for a similar flow.
 |
Figure 7.10 shows the distance of the vorticity
maximum away from the symmetry line for Reynolds numbers 0, 10, 50, and 100.
While a maximum is hard to locate in a vortex method
with an arbitrary distribution of vortices, our results agree well
with the exact Stokes solution (![]() ) and with the results of Ohring and
Lugt. In particular we agree with the conclusion of
Ohring and Lugt
that the maximum moves away from the symmetry plane at all times.
) and with the results of Ohring and
Lugt. In particular we agree with the conclusion of
Ohring and Lugt
that the maximum moves away from the symmetry plane at all times.
 |
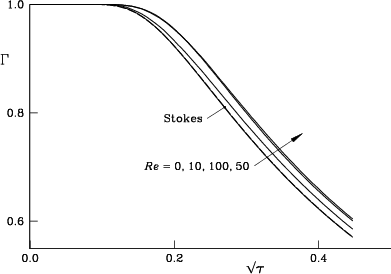
Figure 7.11 shows the decay of the circulation in a half plane with time. We find no dramatic change in circulation with Reynolds number, although the circulation at higher Reynolds numbers decays somewhat more slowly. Our results at zero Reynolds number are almost identical to the exact Stokes solution. These results agree with those of Ohring and Lugt [166]. They also agree with the results of Buntine and Pullin [32] for a smoothed initial condition. Their results at Reynolds numbers 40 and 160 are indistinguishable, similar to our results at 50 and 100. Our curve for Reynolds number 100 ends up between those for 10 and 50.
For this flow, the velocity increases without bound when the Reynolds number increases, especially for small times. This leads to almost singular convection terms at high Reynolds numbers. Yet, our numerical results show that the redistribution method captures such strong convection effects very accurately. Further evidence of the accuracy and reliability of our method, including longer times, will be presented in the next section in which we discuss the propagation or drift velocity of the vortex pair.