


- Measurement of Current Process & Performance: A synopsis on the current NAWCTSD process for ROI data collection and an initial reccomendation on what needs to me improved
- Measure Phase Poster: Updated piece to show data sets established and survey questions to be provided to NAWCTSD for future anaylsis
- Measure Phase Report: An extensive report on how and why certain data was measured as compared
to previous data kept or forgone for this project
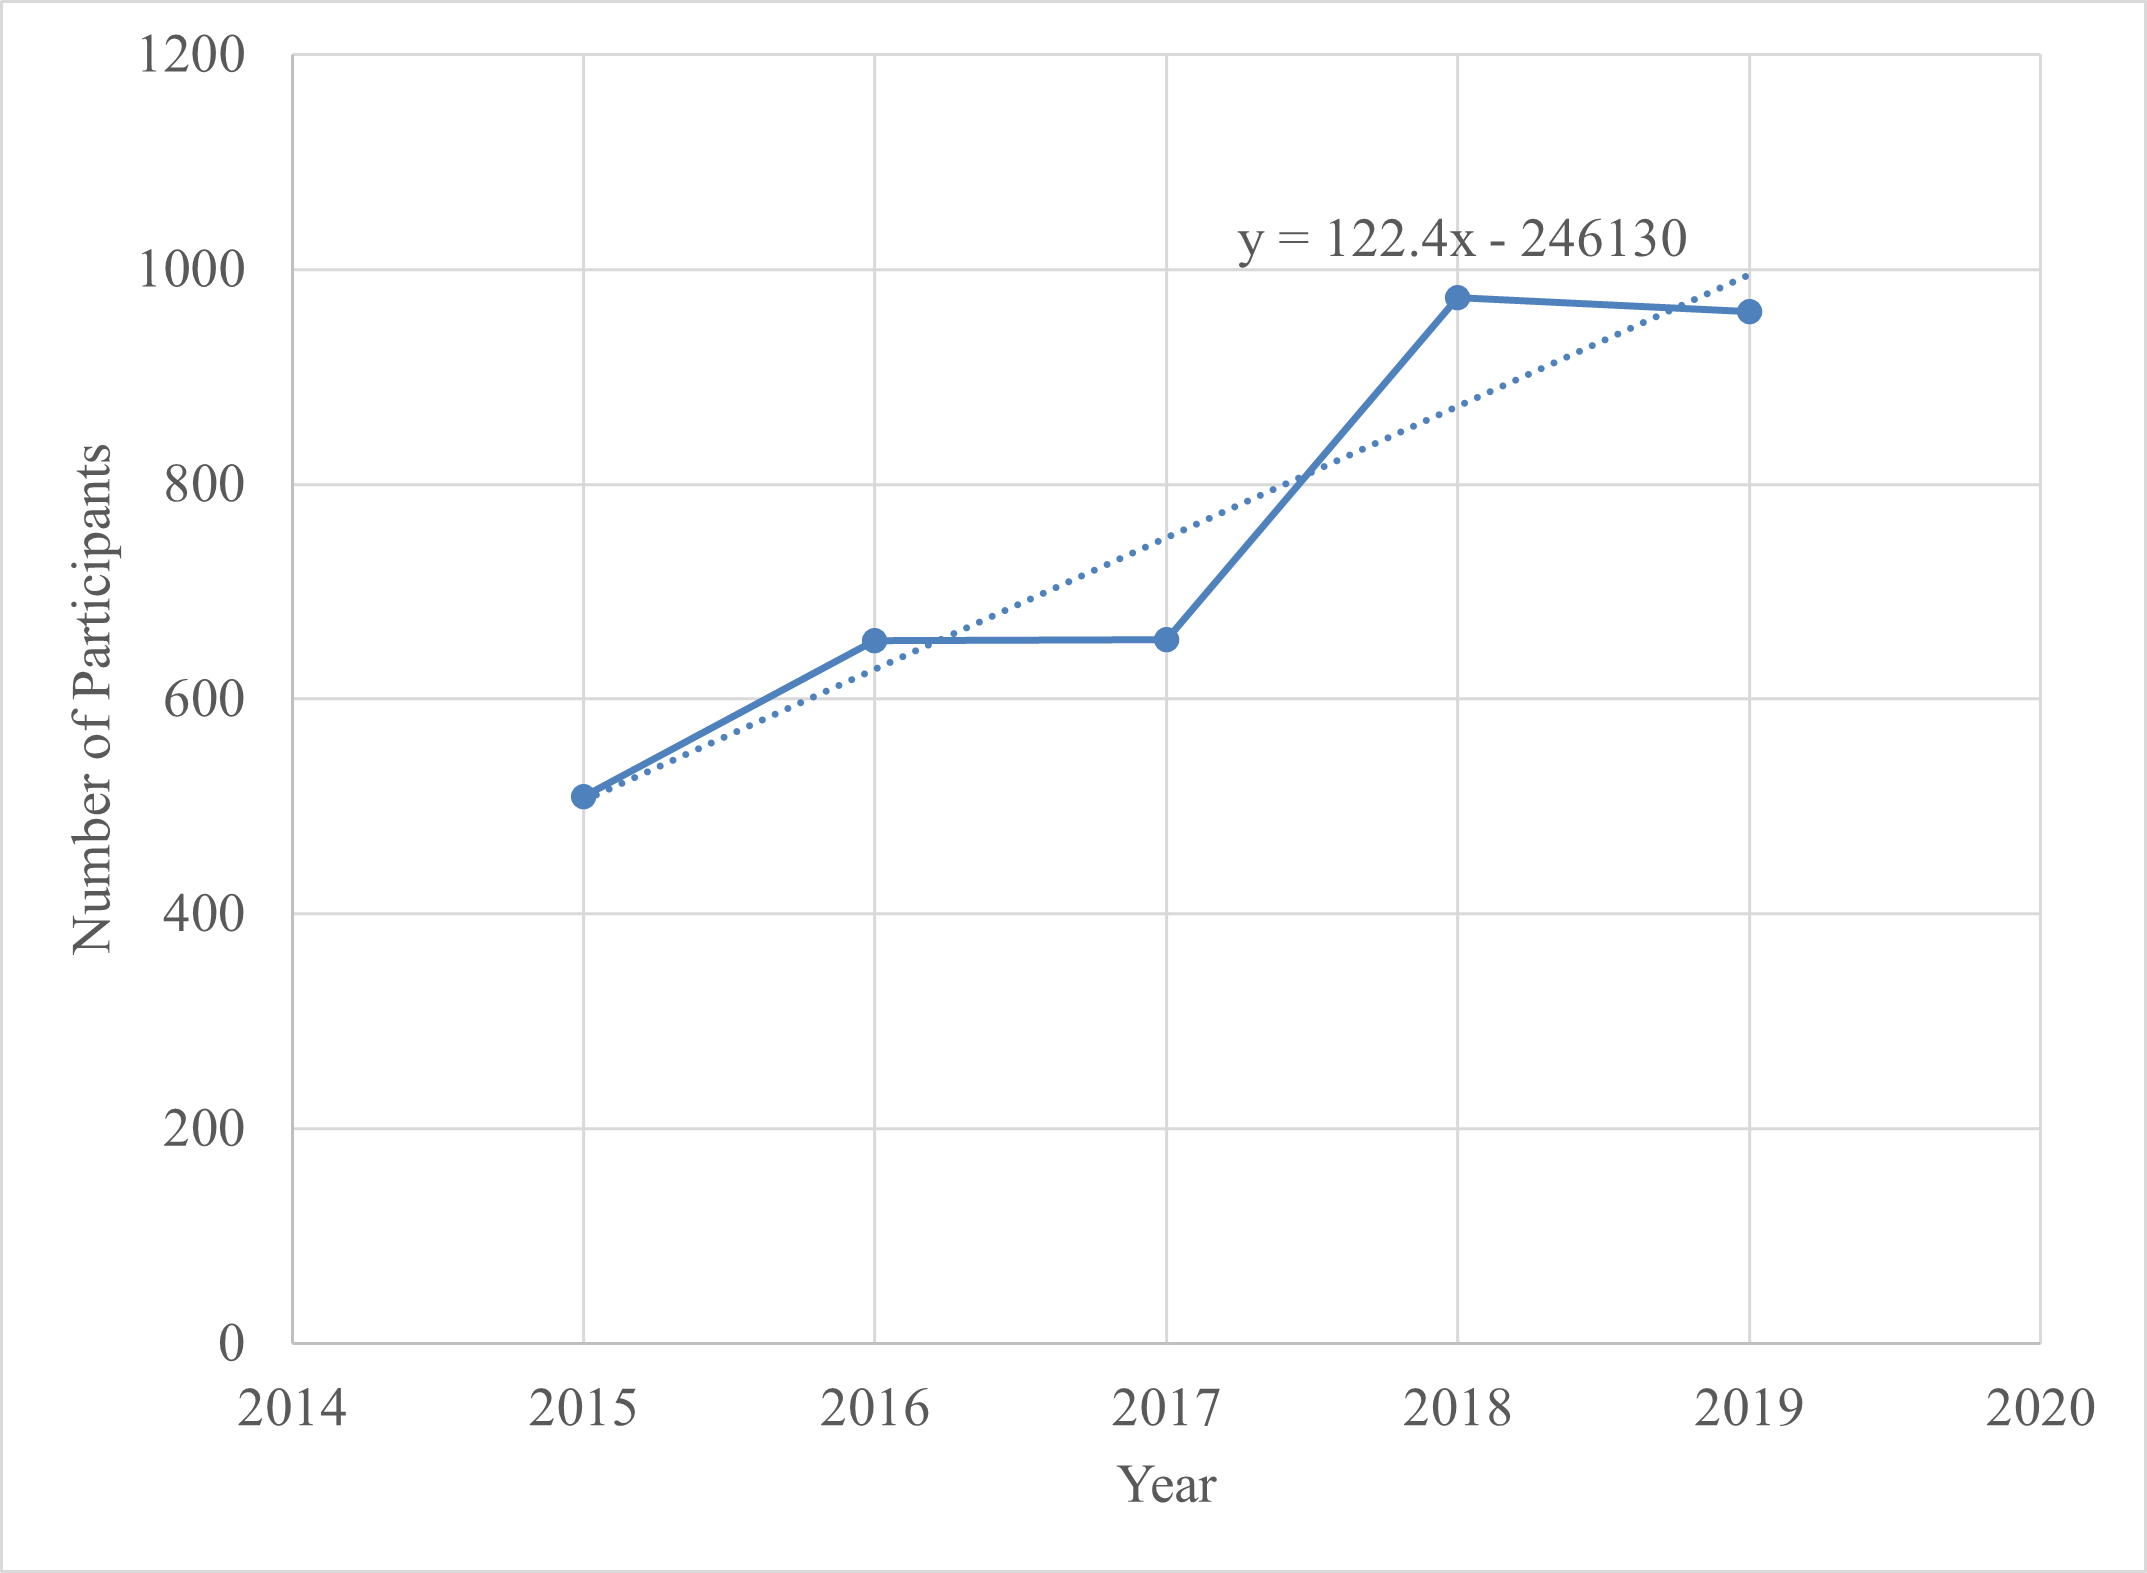
Yearly PALT Attendance (2015-2019)
Monthly PALT Attendance (2018-2021)
PALT Attendance Analysis
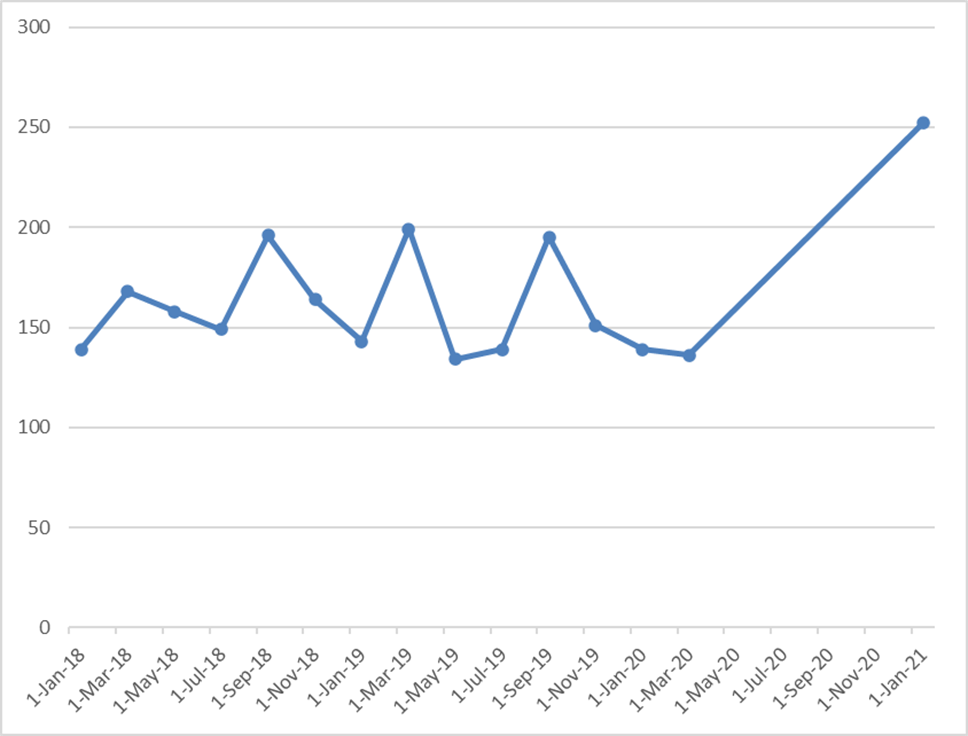
To date, NAWCTSD has sent the team two main data points that include attendance and cost data from PALT events for both yearly and monthly analysis. The attendance data has been converted into a visual representation as seen in the Yearly PALT Attendance Chart. This graph provides a clear example of how attendance at large collaboration events have increased from 2015 to 2019. Additionally, a trend line has been used to convey that total attendance at PALT events is increasing. The Monthly PALT Attendance Chart shows a closer look at the attendance data from 2018 to 2021. The attendance has increased since the COVID-19 Pandemic forced the PALT events to go to Zoom. It is believed this is because more companies where able to attend virtually rather than in person. PALT events are now held in a hybrid model where companies can attend in person or virtually.
Measuring the Baseline Performance
To measure the baseline
performance, NAWCTSD requested that the team put together a list of relevant data
that they should begin to collect to improve an ROI analysis. Over the past two phases the team has developed the following list of data.
1. Speed of innovation and
other time related data
2. How successful the
solution / product from the contract was
3. Cost data related to
events and other costs required to enable collaboration
4. Event attendance
5. Location of
attendees
6. Size of businesses
attending
This list of requested data has
been sent to Cassie Muffley, the stakeholder, and most of it has been conveyed
to her co-workers on how to capture these different types of data. All data on
this list was originally requested by the team, however Mrs. Muffley informed
the team that these data sets were not currently put together and so the team
added them to the list of recommended data to collect.
Measuring the Current Process

As seen in the figure above, the current process that NAWCTSD has in use is confirmed to work for tracking participant attendance. The team has been given an Excel spreadsheet containing all the attendance data to the PALT events from the year 2015 to the present day. The response variable the team is measuring is the attendance of each company. For the team to calculate the return on investment in collaboration, more information is needed than just attendance data. This was an indication that NAWCTSD’s current process needs improvement to solve the return on investment. The main improvement that the team would like to make, in reference to the figure above, would include using data points that correlate collaboration and its importance over time for each tech industry. This would allow NAWCTSD to have a better understanding of their return on investment that each collaboration event is having on their participating companies.
Overall Measurement Plan
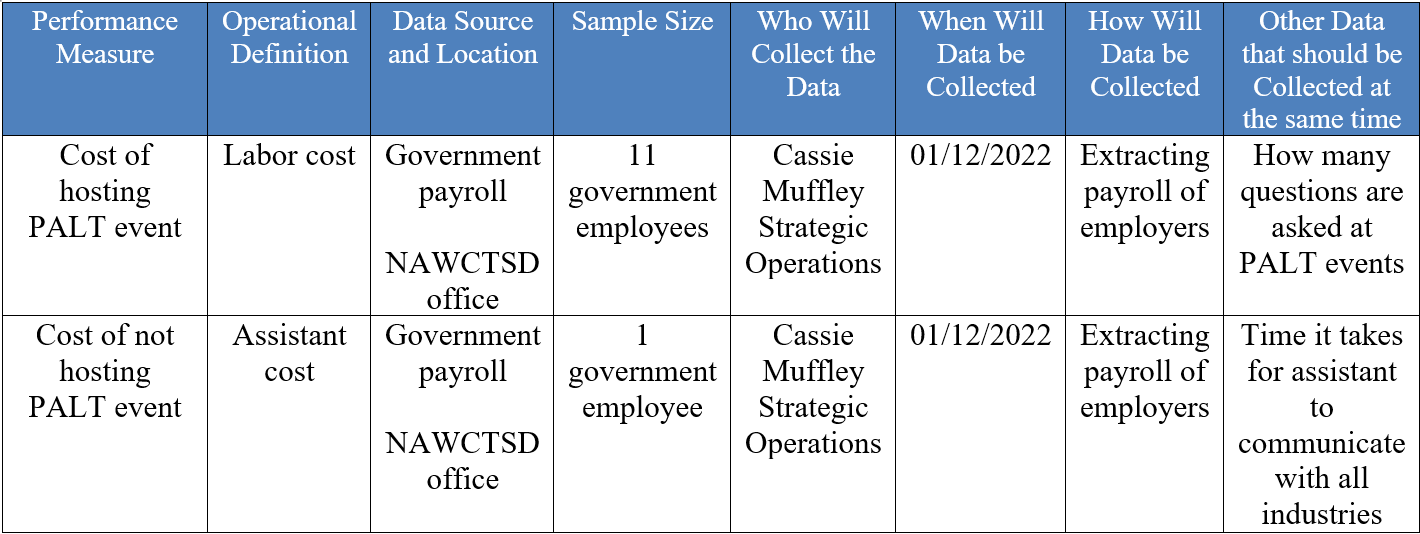
The measurement plan for this new ROI is based off eleven government employees’ salaries that can help narrow down an estimate of the cost it takes to host one PALT event. Then, it would allow the team to compare that cost to a hypothetical situation where instead of hosting collaboration events, NAWCTSD would instead hire an assistant to help answer and communicate to all tech industries about contracts. This would lead to a much higher cost and eliminate collaboration between tech industries and the government. The long-term effect could be more devastating since the tech companies won’t be able to communicate and share the hard work they have worked on.