



- Summary of Collected Data Analysis: A findings piece for all monetary and nonmonetary values
attributed to the ROI for collaboration that will be used for a standardized
method
and future survey data collection
- Analyze Phase Report: An extensive report on the calculations and computer-aided programs used
for the analysis of collaboration data
- Analyze Phase Website: A summary of the Fall Semester project guidelines and structure behind
the creation of new objective deadlines for the final two phases
Establised ROI Cost Data Analysis
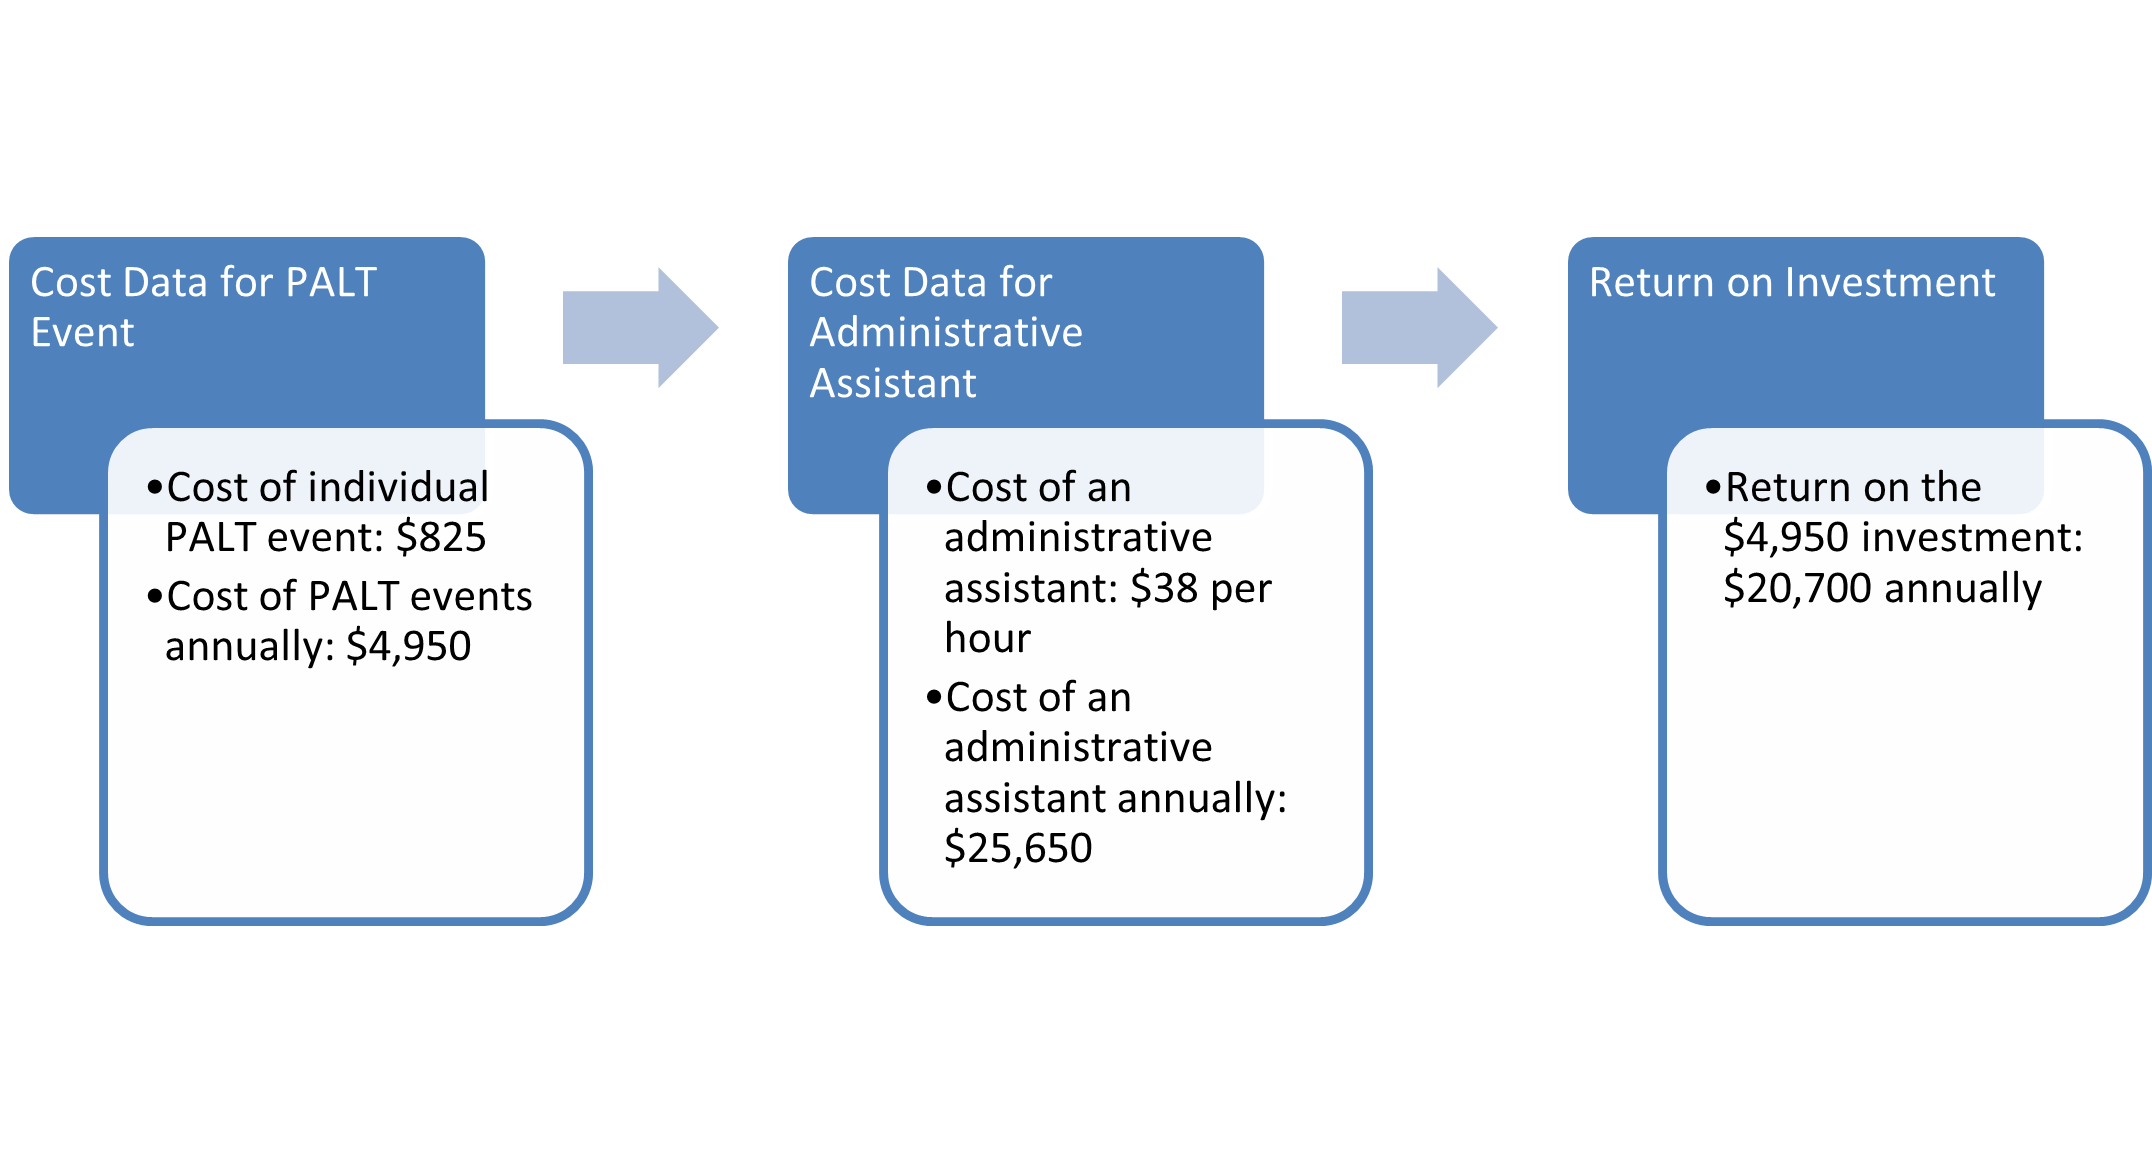
The team has first conducted a comparison analysis of the cost between hosting and not hosting a PALT event. This cost data included how many NAWCTSD employees need to be present at each PALT event as well as their average salary. The team was then able to take this cost and correlate it to an average salary of an assistant that would be needed if PALT events were not held. This showed the team that it cost on average of $4,950 a year to host PALT events with a return-on-investment of $20,700 anually given the cost of hiring an outside contrator. Additionally, not only is NAWCTSD saving time and money by hosting these events, but it also expands the collaboration between industries and the government that would otherwise not exist with the second option. Furthermore, the return on investment of hosting collaboration events allows for more interactions between the U.S. government and tech industries which otherwise would not be so readily available.
Recommended Analysis of Likert Scale Survery Responses
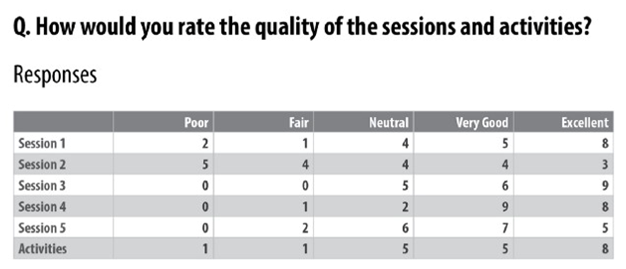
It is well known that utilizing a Likert scale survey is one of the most reliable ways to measure opinions and perceptions to better understand feedback and help pinpoint areas where improvement is needed. Likert scale surveys are good to use when an organization needs to measure sentiment about something specific, in this case collaboration at PALT events, to get a deeper level of detail in the responses that can later be compared for ROI analysis. Once a survey like this is distributed, it is important to understand how it can be analyzed using descriptive statistics to achieve the desired results. In this case, descriptive statistics can be used to summarize the data collected in simple numerical or visual form. To do this, one must analyze the ordinal data, which is used when examining data from individual Likert-type questions. This can be done by finding the mode, or most common score, for each question to find the overall impression of the sample. Additionally, using ordinal data you can create a bar chart for each question to visualize the frequency of each answer. Once the survey is completed by all recipients, it is then important that NAWCTSD moves the answers to an Excel table as shown in the figure above for future analysis.
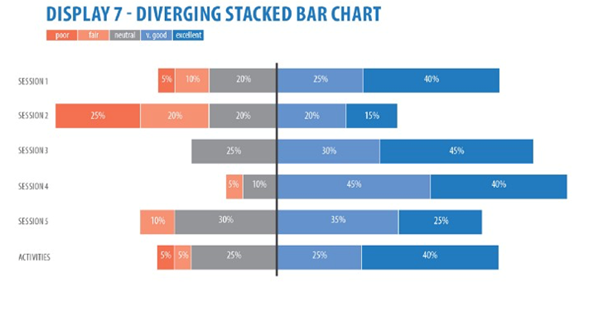
Using different Excel
functions, it is up to the discretion of the organization/NAWCTSD on how the data should
be displayed. Small multiple pie charts, grouped bar charts, large number and
text, and even diverging stacked bar charts can be used to visualize the
responses of the results. Utilizing a stacked bar chart or a diverging stacked
bar chart, as shown in the figure above, is what the Senior Design team deems is the most effective way
to display Likert scale surveys
Finalized Fishbone Diagram For Project Root Cause Analysis

The fishbone diagram above shows the major causes for why NAWCTSD cannot calculate the return on investment in collaboration between the U.S. military and industries. The diagram is divided into four main categories which includes processes, resources, data, and measurements. NAWCTSD has a very limited procedure when it comes to evaluating the data collected from its collaboration events. Currently, the only process for collecting data is the attendance at each PALT event. This process is not standardized as it does not collect data from other large collaboration events held monthly. When it comes to resources, there are no NAWCTSD employers that work specifically on calculating the return on investment for collaboration projects. Furthermore, the number of collaboration events held yearly are very limited which can also limit the amount of data collected from surveys. In the data section, the attendance data was collected before the team started this project which does not help directly calculate the return on investment. Moreover, the data is manually transferred to Excel not creating a standardized format. This will create more manual labor when collecting data and may lead to formatting issues. In the measurement section, it is made clear that NAWCTSD uses a not-for-profit business model which makes it more difficult to calculate a return on investment. The team must use creative solutions through collecting different data at events to calculate the return on investment without using monetary values. Different cost data or requested data can be useful when creating a new currency to calculate a return on investment.