


- Control Phase Poster: A presentational aid on how
NAWCTSD can continue to use the senior design team’s data visualization in
future training to maintain the ROI method established
- Control Phase Report: An extensive report
to conclude how all project objectives were met and how to sustain them
throughout future collaboration events
- Spring Team Website: A summary of how all technical requirements were accomplished according
to the proposed timeline and what work was completed by each team member
Risk Management SWTO Analysis
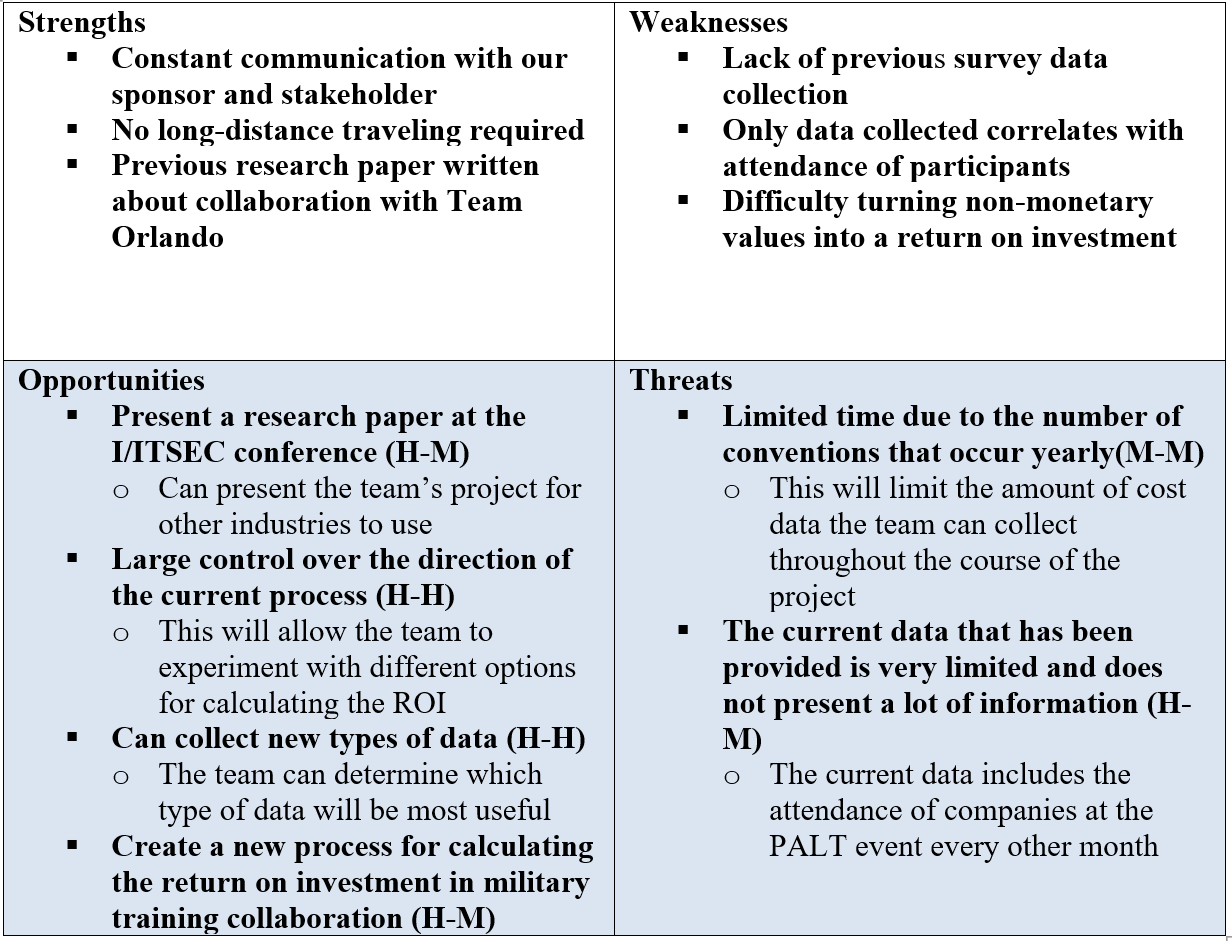
The table above shows the risks that are
associated with completion of this project:
(Impact level - Probability of the
threat happening)
H= High
M= Medium
L= Low
The table displays positive and
negative risks associated with successful completion of this project. Below is a list of strategies taken for each risk presented in the weaknesses, opportunities, and threats of the project.
§ Weaknesses that may
be present when completing this project:
a) Difficulty turning
non-monetary values into a return on investment: Typically, a return on
investment is calculated by monetary values, but in this case, it is a
not-for-profit project. The team has investigated other solutions such as
creating their own currency
b) Lack of previous
data collected: The team plans to fix this weakness by utilizing the PALT cost
data provided to the team from the sponsor
c) Only data collected
correlates with attendance of participants: The team plans on analyzing the
given data to discover any trends and determine if the data can be used in the
calculation of the return on investment
§ Opportunities that
may be present when completing this project:
a) Present a research
paper at the I/ITSEC conference (H-M): The team would like to submit the
project to be presented at the I/ITSEC conference. This would allow the team to
present its findings to other industries and share the results
b) Large control over
the direction of the current process (H-H): The team will research different
topics on how to determine the return on investment in collaboration. This will
direct the team in the correct direction when determining how to move forward
when solving this project
c) Can collect new
types of data (H-H): The team will utilize this opportunity to create a survey
that will collect new information pertaining to the participants and how they
feel about collaboration between their company and the U.S. Military
d) Create a new process
for calculating the return on investment in military training collaboration
(H-M): The team will standardize the process of determining the return on
investment for collaboration and hand it over to NAWCTSD to use in the future
§ Threats that may be
present when completing this project:
a) The current data
that has been provided is very limited and does not present a lot of
information (H-M): The team will use the attendance data to its fullest
capacity to determine if it will be useful when calculating the return on
investment
b) Limited time due to
the number of conventions that occur yearly (M-M): The team will strictly
follow the schedule to ensure that all data can be collected in a timely manner
Controlling the New Process
from Start to Ending Boundary
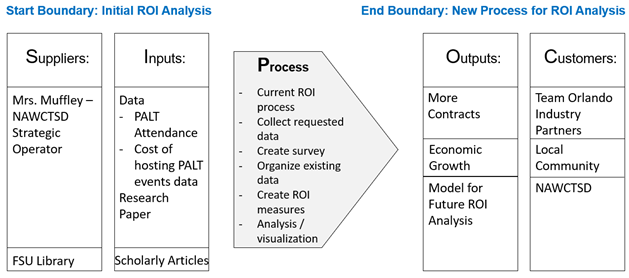
Overall for this
project, relevant collaboration data and previous project research papers were provided primarily by the stakeholder, Mrs. Cassie
Muffley. The data provided included attendance from past
collaboration events and data related to any costs produced from collaborating
with private industry. The FSU Library, specifically the FAMU-FSU College of
Engineering Library,also provided information through scholarly articles
related to conducting an ROI analysis with non-monetary values and other
relevant educational topics. The project does not require additional funding or equipment to process analytical data. The project produced data
collection recommendations for NAWCTSD so they can continue to improve their
ROI analysis after the project was concluded. NAWCTSD successfuly received an establised ROI cost data analysis with visualizations for future training purposes. The team suggests that due to showing a positive return-on-investment between military and private industry, the
military should put more resources towards this type of innovative collaboration. This will
result in more contracts available for Team Orlando industry partners as
well as other industry partners from similar collaboration projects within the
military.
This will encourage more jobs and money in the local community
that positively attributes to economic growth for both civilian and miliatry lives.
Controlled Methodolgy in
ROI Analysis for PALT Events
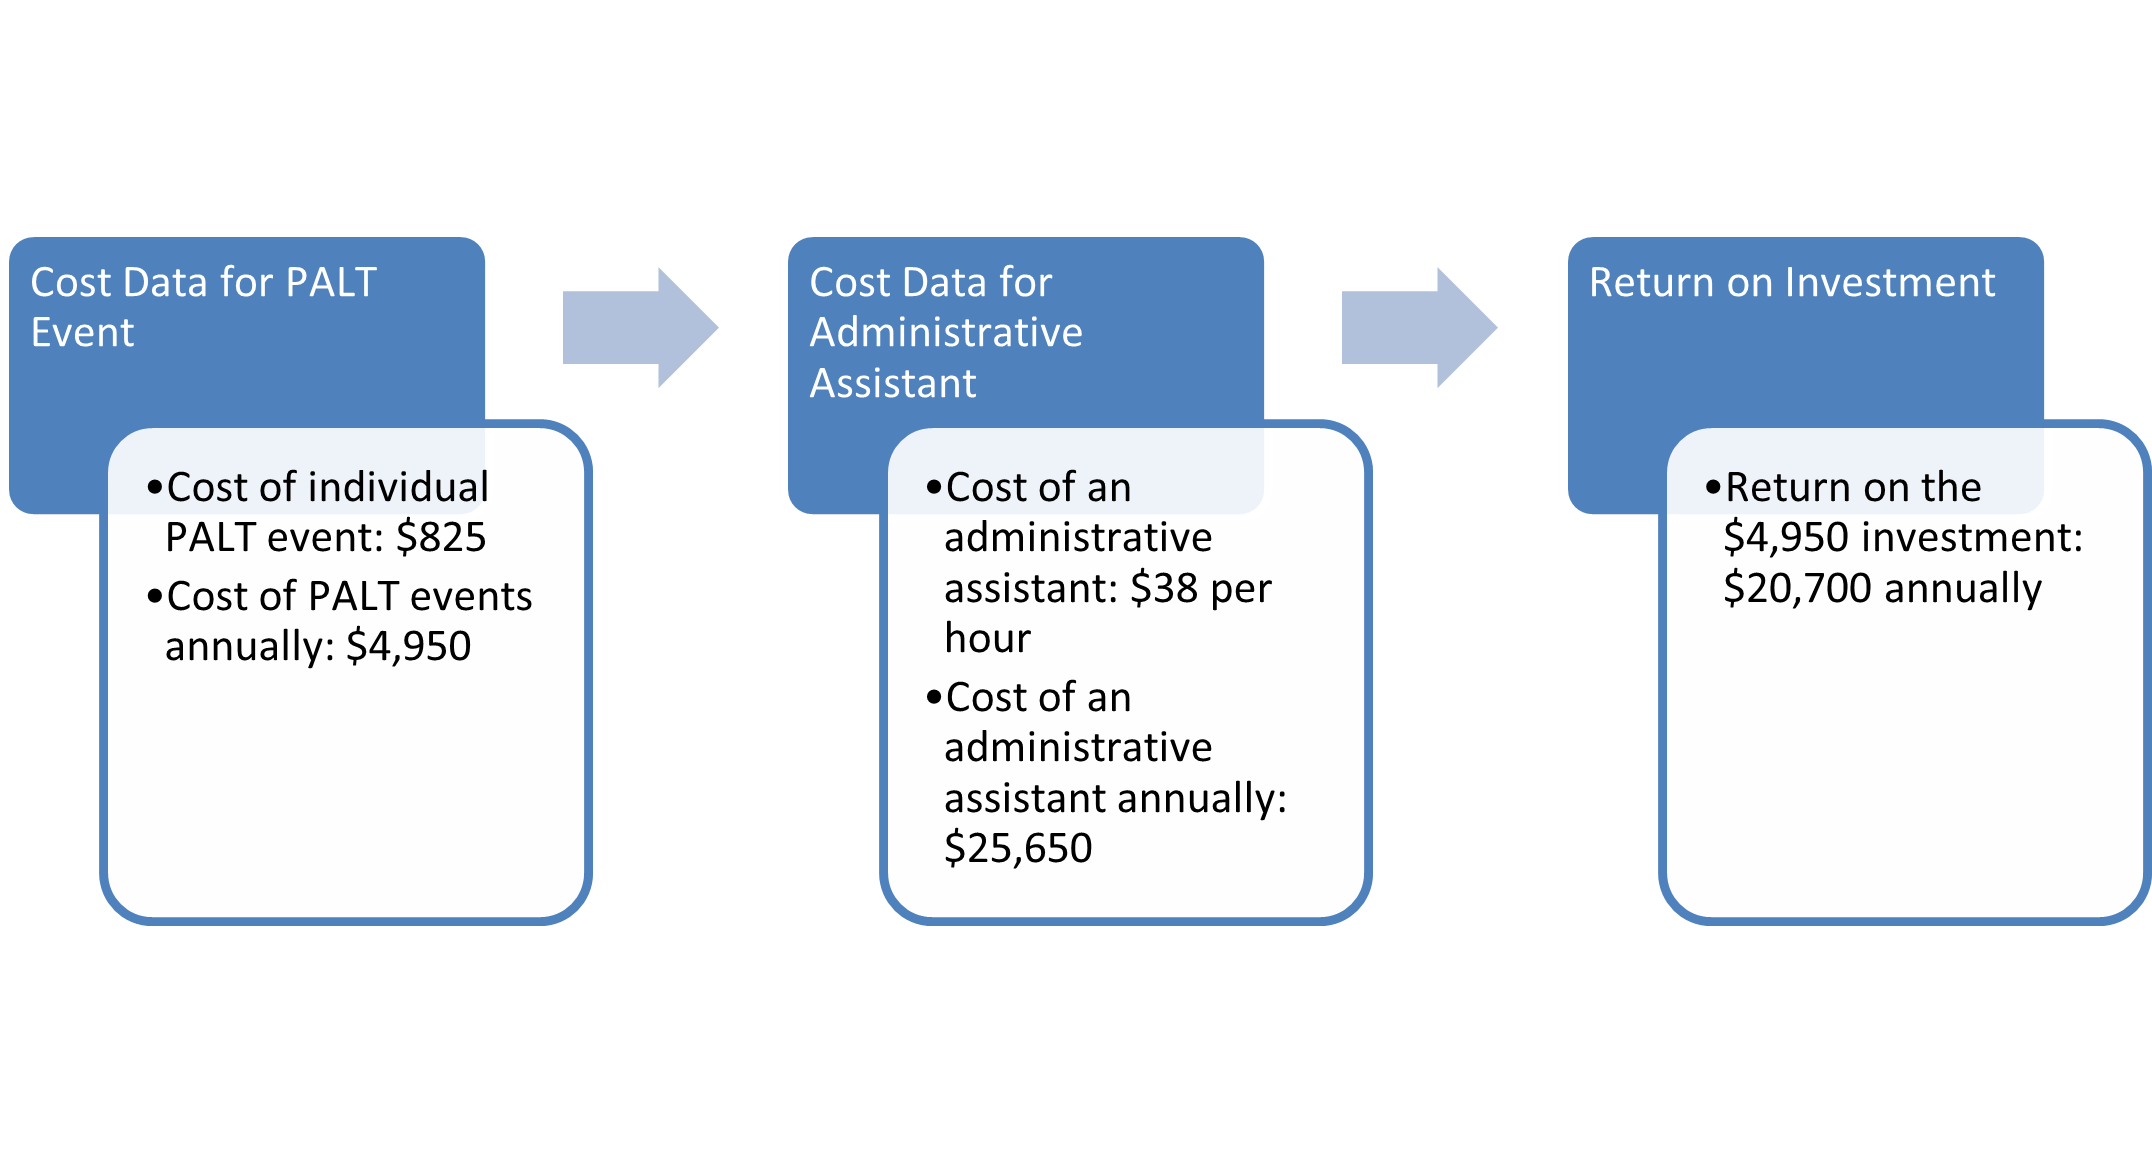
To calculate the ROI analysis for PALT events the team first calculated the annual cost to host the events. The team was told that the only cost associated with hosting the event was the time 11 individuals took to host the event. Each individual spent approximately 1 hour on each event and their annual salaries were $100,000. The team was also told by the sponsor that each employee cost’s the company 150% of their salary when considering things like paid time off, health insurance, etc. Using this information, the team found that the hourly rate for each worker was $75/hr meaning each event would cost $825, giving an annual cost of $4,950 to host PALT Events. The team then went about calculating the annual cost of the alternative method, hiring an administrative assistant to answer all questions that would have been asked at the PALT events. Using an online matrix that shows salary based on job level in the US Navy, it was determined that the administrative assistant would cost $38/hr. The team then estimated that the assistant would spend 112.5 hours answering questions over the course of two months resulting in a bimonthly cost of $4,275 and an annual cost of $25,650. With these numbers the team concluded that the ROI of hosting PALT events rather than hiring an administrative assistant to answer questions would be $20,700 annually.
Implementation Flowchart for
New Improved Process
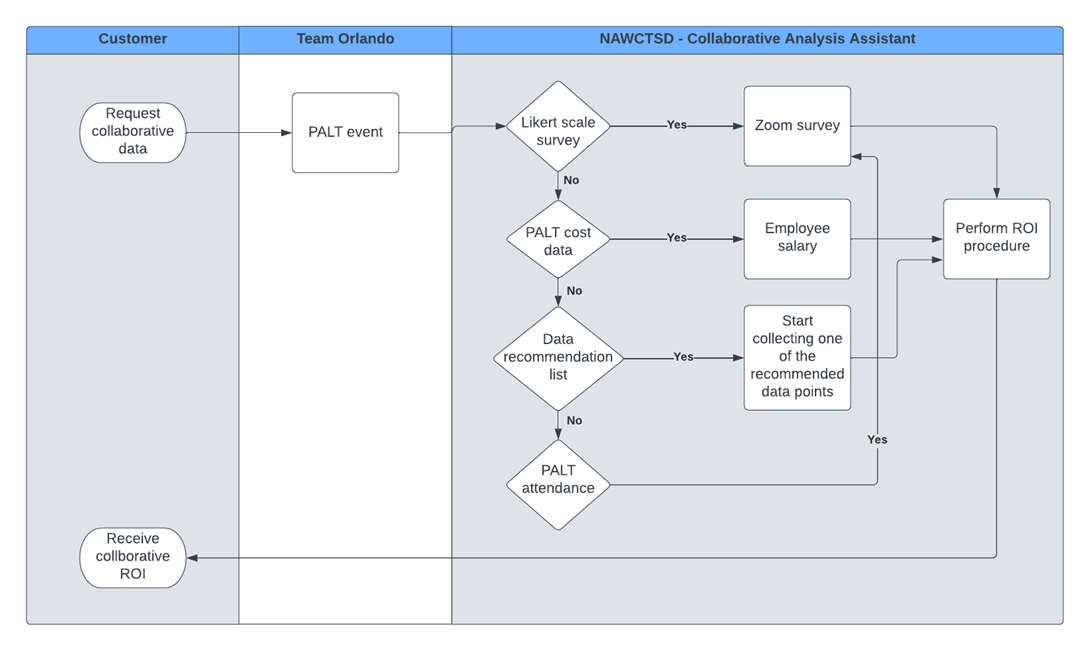
The implementation flowchart above can be utilized when deciding which method should be used when individuals from the government request data on events held by NAWCTSD. Starting from the left column, the customer, in this case it can be individuals within NAWCTSD or from the U.S. government request to see how collaboration events are doing. Then NAWCTSD uses the Team Orlando organization to host multiple collaborative events including PALT events. NAWCTSD would essentially have to delegate the tasks of performing all the collection of data through some type of collaborative analysis assistant. This collaborative analysis assistant would help on determining which of the proposed methods should be used to gather the most relevant data pertaining to the request. Then from there it moves to the execution of how that data can then be calculated, analyzed, and sent back to the customer.