|
|
|
To: 8.2.4 Vorticity field |
In this subsection we show that our computed velocity field is in excellent agreement with other data such as with the boundary layer computations of Van Dommelen & Shankar (unpublished) and agrees with other recent high resolution numerical computations by Anderson & Reider [3], Kruse & Fischer [120], and Wu, Wu, Ma, & Wu [249], as well as experimental data.
 |
 |
For ![]() , we compare our computed velocity with the
experimental results
of Bouard & Coutanceau [29] in figure 8.9.
There is very good qualitative agreement but the wake seems somewhat too
thick. We conjecture that slight unsteadiness might add a bit of
eddy viscosity in the experiments.
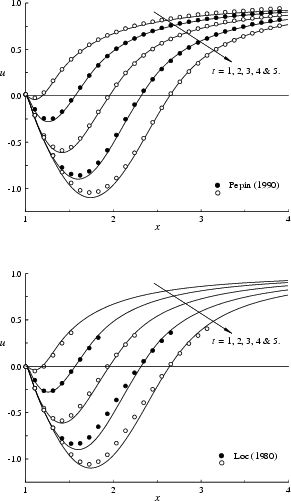
In any case, the computations of Pépin [170]
and Loc [133] in figure 8.10 agree
well with our values for the wake length, instead of with the experiments.
There are still some slight differences between those computations
and between those computations and ours.
Based on our results for
, we compare our computed velocity with the
experimental results
of Bouard & Coutanceau [29] in figure 8.9.
There is very good qualitative agreement but the wake seems somewhat too
thick. We conjecture that slight unsteadiness might add a bit of
eddy viscosity in the experiments.
In any case, the computations of Pépin [170]
and Loc [133] in figure 8.10 agree
well with our values for the wake length, instead of with the experiments.
There are still some slight differences between those computations
and between those computations and ours.
Based on our results for ![]() in figure 8.15,
discussed later, for which much more reference material is available,
we conjecture that our computations at
in figure 8.15,
discussed later, for which much more reference material is available,
we conjecture that our computations at ![]() are the most accurate,
followed by Pépin and then Loc. This is consistent with the fact that
the data of Pépin at
are the most accurate,
followed by Pépin and then Loc. This is consistent with the fact that
the data of Pépin at ![]() are closer to ours than those of Loc.
are closer to ours than those of Loc.
 |
 |
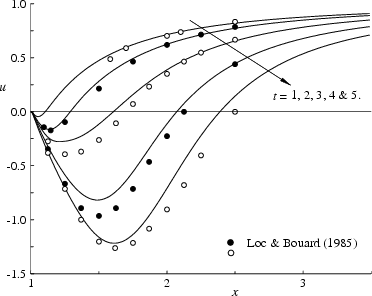
For ![]() , we compare
our computed velocity with that obtained in
experiments of Loc & Bouard [134].
Despite the higher Reynolds number, which tends to enhance instabilities,
the experimental results agree quite well with our data. Again the
experiments show a larger wake size than is supported by our computation.
Six other computations
[40,42,105,134,170,215]
are shown in figure 8.12. Most support our
values for the wake length instead of the experimental ones. A notable
exception is the computation of Loc & Bouard themselves.
Again we conjecture that our computation is more accurate than the other
six, with Pépin [170] and Hakizumwami [105] next.
This is again consistent with the data for
, we compare
our computed velocity with that obtained in
experiments of Loc & Bouard [134].
Despite the higher Reynolds number, which tends to enhance instabilities,
the experimental results agree quite well with our data. Again the
experiments show a larger wake size than is supported by our computation.
Six other computations
[40,42,105,134,170,215]
are shown in figure 8.12. Most support our
values for the wake length instead of the experimental ones. A notable
exception is the computation of Loc & Bouard themselves.
Again we conjecture that our computation is more accurate than the other
six, with Pépin [170] and Hakizumwami [105] next.
This is again consistent with the data for ![]() in figure
8.15.
in figure
8.15.
For ![]() , better comparisons are possible since there is much more
data available. Further, this flow is more difficult to compute, so that
the errors in the various computations show up more clearly. Also, for
this high Reynolds numbers, at early times
the boundary layer is sufficiently thin that the boundary layer
approximation can be used. This is shown in figure 8.13,
where both the standard boundary layer solution as well as second order
theory are plotted at time
, better comparisons are possible since there is much more
data available. Further, this flow is more difficult to compute, so that
the errors in the various computations show up more clearly. Also, for
this high Reynolds numbers, at early times
the boundary layer is sufficiently thin that the boundary layer
approximation can be used. This is shown in figure 8.13,
where both the standard boundary layer solution as well as second order
theory are plotted at time
![]() (unpublished data of Van Dommelen & Shankar).
It may be recalled that in
boundary layer theory
the velocity is expanded in powers of
(unpublished data of Van Dommelen & Shankar).
It may be recalled that in
boundary layer theory
the velocity is expanded in powers of ![]() ;
standard boundary layer theory retains only the first term in
the expansion (the zeroth power of
;
standard boundary layer theory retains only the first term in
the expansion (the zeroth power of ![]() ), while
the second-order boundary layer theory retains the first two terms in
the expansion (up to the first power of
), while
the second-order boundary layer theory retains the first two terms in
the expansion (up to the first power of ![]() ).
The small difference between the two results shows that the boundary
layer approximation is still applicable. Since the boundary layer
approximation is considerably more straightforward than a
Navier-Stokes scheme, figure 8.13 may be the
closest to nontrivial ``hard" data that is available for this flow.
It is therefore gratifying that our computation produces the most
accurate second order theory closely.
).
The small difference between the two results shows that the boundary
layer approximation is still applicable. Since the boundary layer
approximation is considerably more straightforward than a
Navier-Stokes scheme, figure 8.13 may be the
closest to nontrivial ``hard" data that is available for this flow.
It is therefore gratifying that our computation produces the most
accurate second order theory closely.
 |
Figure 8.14 compares the computed radial velocity with that obtained in the experiments of Loc & Bouard [134]. Again the experimental data are in good qualitative agreement, but with a somewhat thicker wake than can be supported by our computations or by most others in figure 8.15.
 |
 |
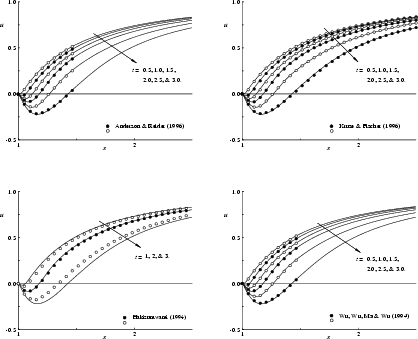
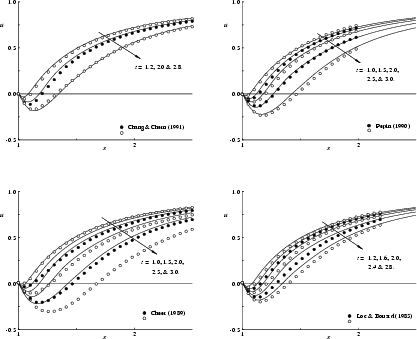
In figure 8.15, we compare our computed velocity with those of other computations. All those eight recent computations agree well on the general evolution of the velocity profile. However, the best agreement occurs between the results of Anderson & Reider [3], Kruse & Fischer [120], Wu, Wu, Ma, & Wu [249], and our results. This provides a strong verification of our data. This is further supported by the fact that the computations we agree with have plenty of resolution: both the mesh based computations use large amounts of mesh points, while the spectral element computation of Kruse & Fischer uses in effect as many as 12,000 spectral elements with 100 nodes per element.
The vorticity field, a derivative of the velocity field, tends to be even more sensitive to numerical errors than the velocity field. We will examine it in the next subsection.