Clear Channel Designed by Team #9
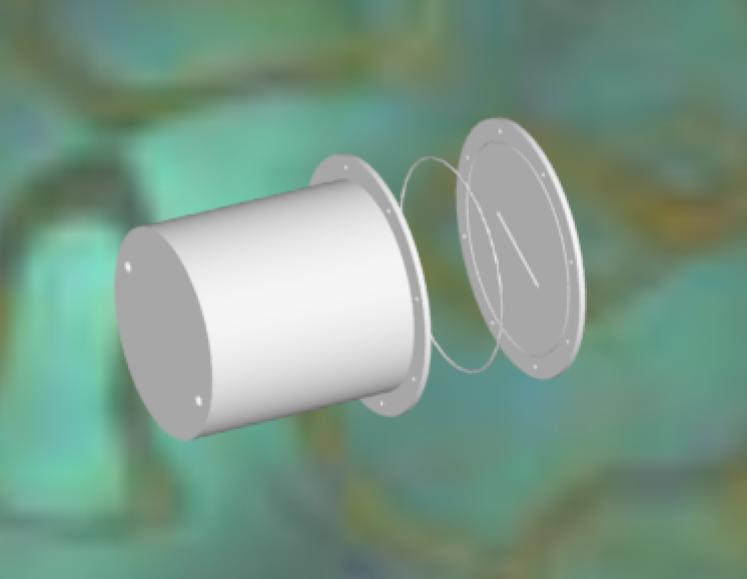
Pro-E Drawing of Chamber
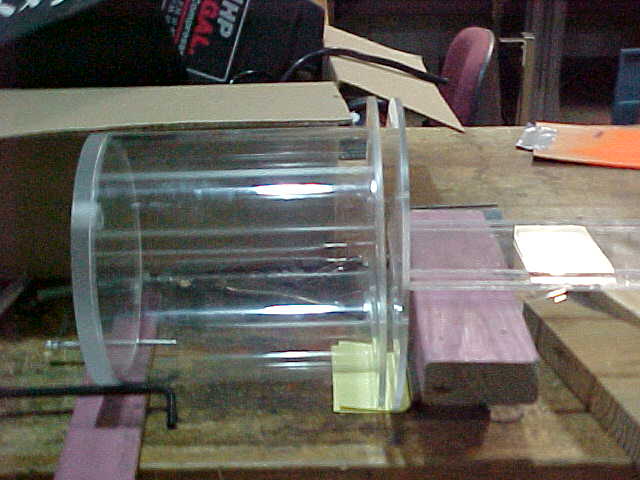


Testing of the Completed Flow Channel
The first aspect of the flow that needs to be addressed is the fact that the fluid level in the chamber isnt the same height as the fluid level in the channel entrance. This is shown with the picture below, figure 2. One can see that the level of fluid in the channel is much lower than the level of fluid in the reservoir. Figures A1 and A2 in appendix A show the flow drops at the exiting end of the test apparatus. Figure A1 even shows the waterfall that formed due to the large difference in liquid levels. Another interesting flow phenomenon that was obtained from the test was the presence of a wave forming at the channel entrance when the airflow is increased enough. This is shown in figure 3 below. Other wave formations can be seen in figures A3 and A4, appendix A.

Figure 2: Entrance Level Drop
Figure 3: Formation of Wave
The other very neat occurrence that was observed was instabilities in
the flow when testing the co-flow. The flow had turbulent instabilities
that would form and flow down the channel amongst a laminar flow. These
turbulent instabilities were apparently caused by the airflow over top
of the water because the turbulence would form at the top of the liquid
and propagate down as the flow moved through the channel. This phenomenon
is shown in figure 4 below. These turbulence bursts would form every now

Figure 4: Turbulence in Co-flow due to Instabilities
and then at a random rate. Appendix A has more pictures with explanations
of what the pictures are of.
The second aspect of the flow that was paid close attention was the
water decrease as the flow moves down the channel. As it was stated in
the introduction, section 1.0, the difference in the pressures will cause
a slope in the liquid level in the channel. The current theory is that
the slope from one chamber to the other is linear. The measuring of the
liquid level seemed to disprove this idea. The data that was taken on the
deviation from no flow, section 2.13, 4-c, are presented in figures B1-B3,
appendix B. The units that were used were the graph paper divisions. One
unit, graph paper division, is equal to 4/32nds of an inch. The measurements
for height were taken at 5 cm increments down the channel. Each graph has
four different water mass flow rates on it, 1.15, 0.9, 0.6, and 0.3 gallons
per minute. The graph of the no airflow test is shown below, figure 5.
The graphs for the other two tests, co-flow and counter-flow, are presented
in figures B2 and B3. These graphs as well as a look at the entire chamber
show that the liquid drop is not a linear function.
This page created with Netscape Navigator Gold